Full-chain temperature management of pharmaceuticals from manufacturing to use is a core requirement of GDP (Good Distribution Practice). Whether it is 2 degrees C to 8 degrees C cold-stored vaccines, 15 degrees C to 25 degrees C ambient temperature drugs, or frozen biological products below -20 degrees C, every storage space must prove through scientific methods that its temperature environment meets regulatory requirements. Temperature Distribution Verification (Temperature Mapping) is the key technical measure for ensuring pharmaceutical warehouse environmental compliance. By systematically deploying calibrated temperature sensors throughout the warehouse space, continuously recording and analyzing the three-dimensional temperature distribution, identifying hot spots and cold spots, it provides an evidence base for temperature monitoring system design and daily management. This article provides a complete analysis of pharmaceutical warehouse temperature distribution verification methodology, execution essentials, and monitoring system design from the dual perspectives of refrigeration and air conditioning engineering and quality management[1].
1. GDP Regulations & Temperature Management Requirements
Temperature distribution verification is not merely a technical engineering activity but a mandatory compliance requirement deeply embedded in the GDP regulatory framework. Understanding the regulatory background and specific requirements is a prerequisite for planning and executing temperature mapping[2].
International GDP Regulatory Framework & Temperature Mapping Requirements
Temperature management across the global pharmaceutical supply chain is governed by multi-level regulations, with each major regulatory framework having clear requirements for temperature distribution verification:
- WHO TRS 961 Annex 5: The World Health Organization lists temperature mapping as a mandatory step in pharmaceutical warehouse facility qualification in its GDP supplementary guidelines. Supplement 8 provides a dedicated chapter detailing temperature mapping execution methods, including mapping protocol development, sensor placement principles, data analysis requirements, and report formats[3]
- WHO TRS 1010: The 2021 updated version further strengthens requirements for transport temperature verification, clearly stating that warehouse and transport temperature mapping methodologies should be consistent, and verification results should serve as the basis for ongoing monitoring point placement[4]
- PIC/S GDP Guide (PE 011): The Pharmaceutical Inspection Co-operation Scheme GDP guide explicitly requires that pharmaceutical storage areas undergo temperature mapping to confirm temperature distribution uniformity, with mapping results subject to periodic re-verification. The guide specifically emphasizes that mapping should be performed under the most extreme seasonal conditions[5]
- EU GDP Guidelines (2013/C 343/01): Section 3.2 of the EU GDP guidelines requires storage areas to be equipped with sufficient temperature monitoring devices based on risk assessment results, with monitoring points set based on temperature mapping results. The guidelines also require both initial mapping and periodic re-mapping[6]
Taiwan GDP Standards & Inspection Practices
Taiwan's Food and Drug Administration (TFDA) has incorporated temperature mapping into inspection items under the GDP regulations developed based on international guidelines. TFDA's GDP inspection criteria require pharmaceutical wholesalers to provide temperature mapping reports for drug storage areas, demonstrating that the storage environment can maintain labeled storage conditions under all seasonal conditions. In practice, TFDA inspectors focus particularly on: whether mapping covers the most severe summer conditions, whether sensor calibration records are complete, whether the mapping report has been reviewed and signed by the Quality Assurance (QA) department, and whether mapping results have been effectively translated into daily monitoring point settings[7].
Temperature Deviation Tolerances & Storage Condition Classification
Different types of pharmaceuticals have varying labeled storage conditions and acceptable temperature ranges, and temperature mapping acceptance criteria must be set accordingly:
- Cold-stored pharmaceuticals (2 degrees C to 8 degrees C): The usable temperature range is only 6 degrees C, making it the most challenging temperature zone for mapping verification. After accounting for sensor calibration error (+/-0.5 degrees C) and system control fluctuations, the actual design margin is extremely limited. Vaccine products require particular attention to the lower limit -- most vaccines irreversibly lose potency after freezing
- Ambient controlled pharmaceuticals (15 degrees C to 25 degrees C): Although the temperature range is wider (10 degrees C), under Taiwan's subtropical climate conditions, outdoor temperatures can reach 35 degrees C to 38 degrees C in summer, and maintaining the 25 degrees C upper limit still requires adequate HVAC capacity. Some pharmaceuticals labeled "not exceeding 30 degrees C" have relatively more design margin
- Frozen pharmaceuticals (below -20 degrees C): Including specific plasma products, frozen vaccines, and biological samples. The temperature range is typically defined as below -20 degrees C (no explicit lower limit), but temperature rise during defrost cycles must still be controlled within acceptable ranges
- Ultra-low temperature pharmaceuticals (-60 degrees C to -90 degrees C): Storage requirements for mRNA vaccines and other emerging biologics, with extremely high temperature control precision requirements and larger calibration uncertainty for sensors at these temperature ranges, requiring special consideration in mapping protocols
2. Temperature Distribution Verification (Temperature Mapping) Methodology
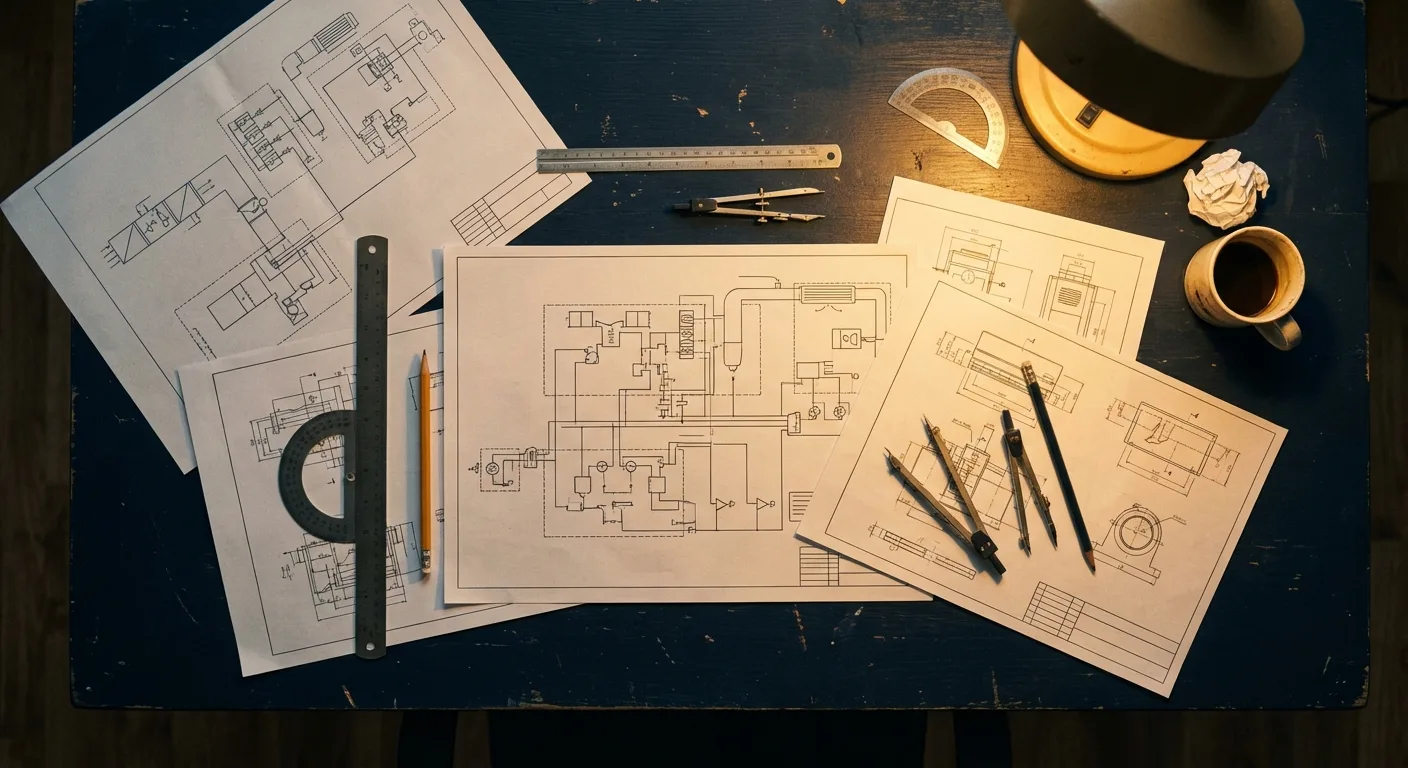
Temperature distribution verification is a systematic engineering verification method, with every step from protocol development and execution condition selection to data collection following rigorous scientific methodology[1].
Verification Timing & Trigger Conditions
Temperature mapping is not a one-time activity but a verification procedure performed repeatedly at specific points during a facility's lifecycle. Scenarios requiring temperature mapping include:
- Before new facility commissioning: As part of facility qualification, executed after IQ (Installation Qualification) and OQ (Operational Qualification) completion and before official operation. This is the initial mapping and serves as the baseline for all subsequent monitoring and management
- After significant changes: Any changes that may affect temperature distribution require re-verification. Common triggers include: HVAC equipment replacement or major repairs, warehouse layout or shelving configuration changes, supply air or return air outlet position adjustments, building envelope modifications (such as added doors, windows, or shading), and significant changes in stored items or stacking methods
- Periodic re-verification: Even without significant changes, periodic re-mapping must be performed to confirm that temperature distribution characteristics have not deteriorated over time. WHO and PIC/S recommended re-verification cycles are typically once a year or every two years, depending on risk assessment results
- After deviation events: If a significant temperature deviation event occurs with a root cause related to the HVAC system or warehouse environment, partial or complete temperature mapping should be performed after corrective actions are completed to confirm the issue has been effectively resolved
Seasonal Selection & Environmental Conditions
Seasonal conditions significantly affect temperature mapping results, and correct season selection is key to ensuring mapping result representativeness. Generally, summer (the season with highest outdoor temperatures) is when the HVAC system load is heaviest and temperature control is most challenging, so summer mapping results represent the worst-case operating conditions. WHO TRS 961 Annex 5 Supplement 8 recommends completing at least one full mapping during both the hottest and coldest seasons[3].
Under Taiwan's climate conditions, summer mapping should be conducted between July and August, when outdoor temperatures are highest (Kaohsiung area design outdoor temperature 35.2 degrees C, relative humidity approximately 70%), fully exposing any HVAC system design margin deficiencies or airflow dead zones. Winter mapping should be conducted between January and February, primarily verifying heating system effectiveness (if applicable) and temperature control stability under low-load conditions. For cold storage rooms and freezer rooms that only require cooling and not heating, winter mapping is relatively less important, but at least one mapping is still recommended to establish a complete baseline dataset.
Test Duration & Recording Interval
The duration of temperature mapping must be long enough to cover all periodic factors that may affect temperature distribution. WHO GDP guidelines clearly recommend a mapping duration of at least 72 consecutive hours (3 days), covering at least one complete operational cycle (including business days and non-business days)[8]. For large logistics distribution centers or facilities with particularly strict temperature control requirements, extending to 7 days (including a complete weekly operational cycle) is recommended to fully capture the impact of different operational modes (such as high weekday loads and low weekend loads) on temperature distribution.
Data recording intervals should not exceed 5 minutes. Shorter recording intervals (such as 1 minute) provide more detailed temperature change information helpful for identifying transient temperature fluctuations (such as defrost cycles or door opening effects), but also generate enormous data volumes requiring sufficient logger memory capacity and data analysis tools. In practice, a 3-minute recording interval is a common choice that balances data precision and manageability.
Empty Load & Full Load Testing
A complete temperature mapping protocol should include both empty load and full load test conditions:
- Empty load test: Performed with no goods or only minimal goods in the warehouse. The empty load test reflects the HVAC system's inherent temperature control capability and airflow distribution characteristics, unaffected by goods stacking obstructing airflow. This is the most direct method for identifying temperature non-uniformity areas caused purely by HVAC design
- Full load test: Performed with the warehouse at normal operating load (typically 70%-90% of design capacity). The full load test reflects temperature distribution under actual operating conditions, where goods stacking patterns, shelf spacing, and aisle widths all affect airflow paths, potentially creating new hot spots or cold spots in areas not observed during the empty load test
During initial mapping, it is recommended to first perform the empty load test to confirm the HVAC system's baseline performance, then the full load test to verify actual operating conditions. If constrained by time or cost, at minimum the full load test must be performed, as it better reflects actual operational risks.
3. Sensor Placement Strategy
The quantity, location, and height of sensor placement are the core determinants of temperature mapping quality. A scientific placement strategy must balance "adequate spatial coverage" with "economic feasibility"[9].
3D Spatial Grid Placement Method
The foundation of temperature mapping sensor placement is a three-dimensional spatial grid (3D Grid). The warehouse space is equally divided along the length (X), width (Y), and height (Z) axes, with a temperature sensor placed at each grid node. This systematic placement method ensures uniform and complete spatial coverage. Grid spacing depends on space size and required resolution -- smaller spacing yields higher temperature distribution "resolution," but requires more sensors.
Basic grid placement principles: horizontal (X, Y axis) grid spacing should not exceed 3-5 meters, and the height axis (Z) should have at least three levels (bottom, middle, top). For warehouses exceeding 6 meters in height, one monitoring level should be placed every 2-3 meters in the vertical direction.
Minimum Sensor Quantity Calculation
Regulatory bodies and industry guidelines have slightly different recommendations for minimum sensor quantities, but the basic logic is consistent -- the number of sensors should increase with space volume, with the rate of increase decreasing for larger volumes. The following are commonly used reference benchmarks for sensor quantities:
- Small storage spaces (up to 50 m3): Minimum 9 sensors (a basic 3x3 grid covering 3 points at upper, middle, and lower height levels)
- Medium warehouses (50-200 m3): Minimum 15 sensors, with 18-20 recommended for improved spatial resolution
- Large warehouses (200-500 m3): Minimum 20 sensors, adding 2-3 sensors per additional 50 m3
- Extra-large logistics centers (over 500 m3): Base of 25 sensors, adding 2-3 per additional 100 m3. For spaces exceeding 2,000 m3, the rate of increase may be reduced based on risk assessment
The above quantities are minimum requirements. In practice, quantities should be increased based on the geometric complexity of the space, HVAC system configuration, and previous mapping experience. Higher-risk areas (such as doorways, corners, sun-exposed walls) should have denser sensor placement, unrestricted by minimum quantity limits.
Key Location Placement Requirements
In addition to systematic grid placement, sensors must be placed at the following key locations, even if these locations are not on standard grid nodes:
- Eight corners: The eight vertices of a rectangular space (four ceiling corners and four floor corners) are areas where airflow is least likely to reach and most likely to exhibit temperature anomalies. Sensors at each corner should be placed 15-30 cm from each adjacent wall
- Geometric center: The geometric center of the space (both horizontal and vertical center) represents the average temperature state and serves as an important reference baseline point
- Door areas: Doors are the primary path for external heat infiltration, with door-opening operations causing localized temperature increases. Sensors should be placed at upper, middle, and lower heights 1-2 meters inside the door
- Below evaporator air outlets: The area directly below the evaporator is typically the coldest zone (cold spot candidate location), with sensors placed 30-50 cm from the evaporator air outlet
- Farthest point from evaporator: By the time airflow reaches the farthest point it has fully mixed with warehouse air, and temperature may be higher than the setpoint -- this is typically a hot spot candidate location
- Different height levels: Due to natural convection effects of warm air rising and cold air sinking, temperatures at different heights may vary significantly. Sensors should be placed at 15 cm above floor level (lowest layer), mid-shelf height, and 15 cm below ceiling (highest layer)
- Inner side of sun-exposed walls: The inner surface of exterior walls exposed to solar radiation has higher temperatures, especially west-facing walls and areas beneath the roof
- Pipe penetrations and near electrical equipment: Pipe wall penetration points may form cold bridges, while electrical equipment (such as distribution panels, lighting fixtures) generates localized heat dissipation
Sensor Calibration & Technical Specifications
All sensors used for temperature mapping (typically standalone digital temperature data loggers) must be calibrated before mapping execution, with calibration performed by ISO/IEC 17025 accredited laboratories (TAF accredited laboratories in Taiwan). Calibration requirements include: calibration deviation not exceeding +/-0.5 degrees C (WHO recommendation), calibration temperature range covering the mapping target temperature zone, and calibration certificates stating calibration uncertainty and within validity period (typically one year). After mapping completion, post-calibration of sensors is recommended to confirm that no drift occurred during the mapping period[10].
4. Data Analysis & Reporting
The true value of temperature mapping lies in data analysis. Raw temperature recording data, through systematic statistical analysis and visualization, can be transformed into meaningful engineering decision-making bases[8].
MKT (Mean Kinetic Temperature) Calculation
Mean Kinetic Temperature (MKT) is one of the most important statistical indicators in pharmaceutical temperature management. MKT is not a simple arithmetic mean temperature but a weighted equivalent temperature that accounts for the nonlinear effect of temperature on chemical degradation rate (per the Arrhenius equation). In other words, MKT represents "the constant temperature that, if the pharmaceutical were always exposed to it, would produce the same degree of degradation as the actual temperature fluctuations"[11].
The MKT formula is: MKT = (Delta-H/R) / [-ln((e^(-Delta-H/RT1) + e^(-Delta-H/RT2) + ... + e^(-Delta-H/RTn)) / n)], where Delta-H is the activation energy (typically 83.144 kJ/mol as a conservative estimate), R is the gas constant (8.314 J/(mol*K)), and T1 through Tn are the absolute temperatures (K) at each time point. Because MKT is more sensitive to high temperatures than low temperatures, brief high-temperature deviations have a significant upward effect on MKT, which is why MKT is more informative than arithmetic mean temperature when evaluating the impact of temperature deviations on pharmaceutical quality.
USP General Chapter <1079> provides detailed guidance on MKT application, recommending that the mapping report calculate MKT for each sensor location and compare it with the pharmaceutical's labeled storage conditions[11].
Maximum & Minimum Temperature Analysis
In addition to MKT, the following statistical indicators must be calculated and presented for each sensor location:
- Maximum temperature (Tmax): The highest temperature value recorded during the entire mapping period and its occurrence time. Tmax is the direct basis for determining whether the upper storage condition limit was exceeded
- Minimum temperature (Tmin): The lowest temperature value recorded during the entire mapping period and its occurrence time. For cold-stored pharmaceuticals (especially vaccines), Tmin is the key indicator for assessing freezing risk
- Arithmetic mean temperature (Tavg): The simple average of all recorded data points, representing the overall temperature trend
- Standard deviation (SD): Reflects the magnitude of temperature fluctuations. A smaller standard deviation indicates more stable temperature control
- Temperature range (Range = Tmax - Tmin): Reflects the extreme fluctuation range of temperature
Temperature Distribution Maps & Isothermal Lines
Spatially visualizing each sensor's statistical data is the most intuitive and engineering-valuable part of the temperature mapping report. Common visualization methods include:
- Isothermal contour map: Isothermal lines drawn on the warehouse floor plan clearly present the spatial temperature gradient. Typically, horizontal isothermal maps are drawn for each height level, as well as vertical isothermal maps through key cross-sections
- 3D temperature distribution map: Software renders the three-dimensional temperature distribution using color gradients, intuitively showing the spatial relationship of hot spots and cold spots
- Time series trend chart: Temperature trend curves over time for each sensor, clearly presenting dynamic characteristics such as day-night temperature differences, door-opening effects, and defrost cycles
Hot Spot & Cold Spot Identification
Hot spot and cold spot identification is the most core output of temperature mapping. Hot spots are defined as the locations with the highest MKT or Tmax during the mapping period, representing the weakest temperature control areas in the warehouse; cold spots are defined as locations with the lowest MKT or Tmin, representing the areas with the highest risk of overcooling or freezing. Hot spot and cold spot identification results directly determine the continuous monitoring system's monitoring point configuration -- daily monitoring sensors should be placed at least at the identified hot spot and cold spot locations to ensure the most extreme temperature conditions are detected first.
Verification Report Format & Review
The temperature mapping verification report is one of the core documents for GDP inspection, and its format and content must meet the following requirements:
- Protocol description: Mapping objective, acceptance criteria, execution period, outdoor conditions, HVAC system operating status, warehouse loading status
- Sensor information: Sensor model, quantity, calibration status (including calibration certificate number and validity), placement location map (with 3D coordinates)
- Raw data: Complete time series data for each sensor (typically presented as appendices)
- Statistical analysis: Summary table of Tmax, Tmin, Tavg, MKT, and SD for each sensor
- Visualization charts: Isothermal maps, trend charts, hot spot/cold spot location marking diagrams
- Conclusions and recommendations: Whether mapping results meet acceptance criteria, identified hot spot/cold spot locations, recommended ongoing monitoring points, HVAC system adjustment recommendations (if any)
- Signatures: Signatures and dates of execution personnel, reviewer (QA), and approver
Need professional planning and execution for pharmaceutical warehouse temperature mapping? Contact our engineering team for a GDP-compliant temperature distribution verification plan.
5. Temperature Monitoring System Design
After temperature mapping is completed, its results must be translated into the design basis for a continuous temperature monitoring system. A comprehensive monitoring system is the foundational infrastructure for daily GDP compliance[5].
Continuous Monitoring vs. Periodic Recording
Temperature monitoring can be divided into two basic modes: continuous monitoring and periodic recording. GDP regulations explicitly require pharmaceutical storage areas to adopt continuous monitoring with sampling intervals not exceeding 5 minutes. Periodic manual inspection recording (such as twice-daily readings with a thermometer and manual recording) no longer meets modern GDP compliance requirements and can only serve as a supplementary measure to automated monitoring systems.
The core advantages of continuous monitoring systems include: complete capture of brief temperature deviation events (such as temperature rises during door-opening operations or defrost cycles), providing uninterrupted data records to meet GDP documentation completeness requirements, automated pre-alarm and emergency alert notification mechanisms, and providing historical data for trend analysis and annual review.
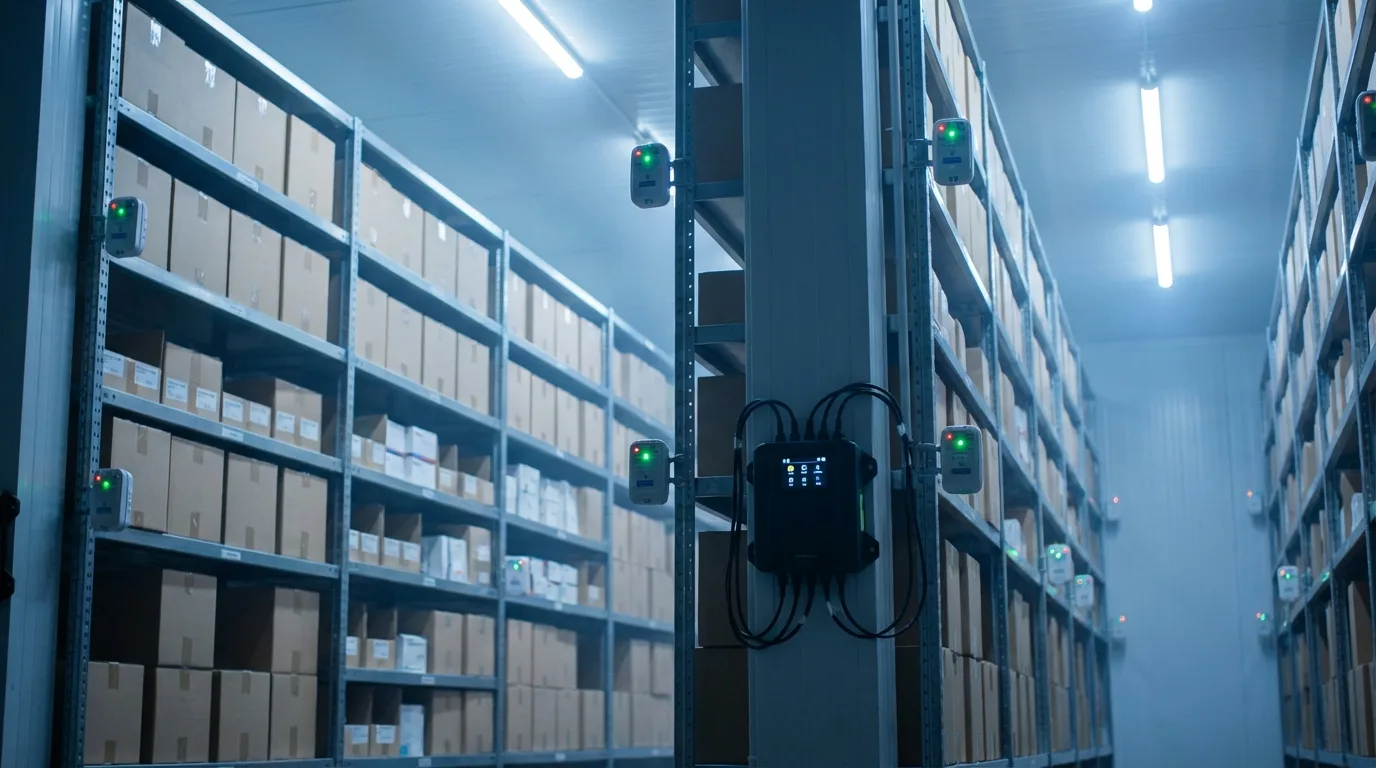
Wired Sensors vs. Wireless Sensors
Temperature monitoring system sensors can be divided into two major categories -- wired and wireless -- based on communication method, each with appropriate application scenarios and advantages/disadvantages:
- Wired sensors (4-20mA / RS-485 / Modbus): Stable and reliable signal transmission unaffected by electromagnetic interference, no battery life issues. Disadvantages include higher wiring installation costs, difficulty adjusting sensor positions, and challenges retrofitting wiring in operating warehouses. Suitable for new facilities or critical temperature zones (such as cold-stored vaccine storage) requiring the highest reliability
- Wireless sensors (Wi-Fi / Zigbee / LoRa / Bluetooth): High installation flexibility, sensor positions adjustable at any time, fast installation with minimal impact on existing facilities. Disadvantages include periodic battery replacement needs (typically 1-3 years), potential wireless signal obstruction in warehouse environments with dense metal shelving, and significant battery performance degradation for some wireless protocols in low-temperature environments (below -20 degrees C). Suitable for upgrades to existing facilities or applications requiring frequent sensor position adjustments
In practice, many pharmaceutical warehouses adopt a hybrid architecture -- critical monitoring points (hot spots, cold spots) use wired sensors for maximum reliability, while auxiliary monitoring points use wireless sensors to reduce costs and maintain placement flexibility.
Cloud Monitoring Platform
Modern temperature monitoring system data management has gradually migrated from local servers to cloud platforms. Cloud monitoring platform advantages include: multi-site centralized management (pharmaceutical logistics operators can monitor temperature status across all national warehouses from a single interface), real-time remote access (managers can check real-time temperatures and historical trends via smartphone or tablet), automated report generation (monthly, quarterly, annual reports generated on schedule), and high availability and data backup (cloud server availability typically far exceeds self-built server rooms).
Cloud platform selection should consider: whether data centers are located within Taiwan (complying with data localization requirements of the Personal Data Protection Act), whether the platform has ISO 27001 information security certification, whether data transmission and storage uses encryption, and whether the platform supports electronic signatures and audit trail functionality required by GDP.
21 CFR Part 11 Compliance: Electronic Signatures & Audit Trails
21 CFR Part 11 is a regulation on electronic records and electronic signatures established by the U.S. FDA. While its legal force is limited to the United States, it has been widely adopted by the global pharmaceutical industry as a compliance benchmark for temperature monitoring systems. Taiwan's GDP inspections also increasingly emphasize data integrity of monitoring systems, consistent in spirit with 21 CFR Part 11[12].
A temperature monitoring system compliant with the spirit of 21 CFR Part 11 must include the following capabilities:
- Electronic signatures: Critical operations within the system (such as confirming deviations, approving reports, changing settings) must be recorded with electronic signatures identifying the operator. Electronic signatures must include at minimum the operator's unique ID and password, with the signature action bound to specific operational events
- Audit trail: The system must automatically record all data creation, modification, and deletion operations, including the operator, operation time, and data content before and after the operation. Audit trail records must not be modifiable or deletable by any user (including system administrators)
- Access control: Role-Based Access Control (RBAC), where users at different levels can only access functions and data relevant to their responsibilities. System administrator account usage must be strictly monitored
- Data backup and recovery: Regular automatic backup of temperature data and system settings, with backup media stored off-site. Data recovery procedures must be periodically tested to ensure backup effectiveness
- Computer System Validation (CSV): The monitoring system itself must undergo IQ/OQ/PQ qualification procedures to demonstrate that its functions meet design specifications and data processing accuracy has been verified
6. Deviation Management & CAPA
Even with comprehensive temperature mapping and monitoring systems, temperature deviations cannot be completely avoided. Establishing a systematic deviation management process is the last line of defense for GDP compliance[5].
Temperature Deviation Handling Process
When the monitoring system detects temperatures outside the set range, a deviation handling procedure must be immediately initiated. A complete deviation handling process includes the following steps:
- Step 1: Immediate response (0-15 minutes): On-duty personnel should confirm the deviation status within 15 minutes of receiving the alarm. After confirming the deviation is a real event (ruling out false alarms such as sensor malfunctions), immediately initiate emergency measures -- including starting backup HVAC units, closing warehouse doors, suspending goods receiving/shipping operations, or transferring affected pharmaceuticals to backup qualified areas
- Step 2: Deviation recording: Thoroughly record the deviation's occurrence time, duration, maximum/minimum temperature values, affected area scope, affected pharmaceutical items and batch number list, and immediate emergency measures taken
- Step 3: Quality impact assessment: QA personnel evaluate the impact of temperature exposure during the deviation on pharmaceutical quality based on stability data. Assessment tools include MKT calculation, comparison with pharmaceutical label conditions, and manufacturer consultation when necessary. Assessment conclusions are classified into three levels: quality unaffected (may continue use), quality uncertain (requires further testing or manufacturer consultation), quality compromised (must be quarantined and disposed of)
Risk Assessment (Product Impact)
The impact of temperature deviations on pharmaceutical quality depends on a comprehensive assessment of multiple factors: the magnitude of deviation from labeled conditions, deviation duration, the pharmaceutical's temperature sensitivity (determined by stability data), the pharmaceutical's cumulative temperature exposure history, and remaining shelf life at the time of deviation. Risk assessment methodology can reference the ICH Q9 Quality Risk Management guideline, with commonly used tools including Failure Mode and Effects Analysis (FMEA), Risk Priority Number (RPN) calculation, and decision tree analysis.
Corrective and Preventive Actions (CAPA)
Each temperature deviation event requires root cause analysis and corresponding corrective actions and preventive actions. Common root cause analysis tools include the Ishikawa (fishbone) diagram, 5 Whys method, and Fault Tree Analysis (FTA). Root cause classifications typically cover the following categories:
- Equipment factors: HVAC unit failure, evaporator frosting, control valve malfunction, sensor drift
- Human factors: Warehouse door left open, HVAC settings accidentally changed, receiving/shipping operations exceeding time limits
- Procedural factors: Incomplete SOPs, alarm response process deficiencies, shift handover procedure gaps
- Design factors: Insufficient HVAC capacity, airflow design deficiencies, insulation deterioration, inadequate backup mechanisms
Corrective actions address the root cause of deviations that have occurred (such as repairing faulty equipment, correcting SOPs), while preventive actions proactively deploy safeguards against potential risks (such as adding backup capacity, strengthening personnel training, shortening maintenance cycles). Each CAPA must have an assigned responsible person, completion deadline, and effectiveness verification method, and must be tracked to complete closure[13].
Annual Review
GDP requires a comprehensive annual review of the temperature management system to identify systemic trends and continuous improvement opportunities. The scope of the annual review should cover:
- Full-year temperature deviation event statistics and trend analysis (number of deviations, duration, root cause classification)
- Annual MKT trends (whether monthly MKT changes at each monitoring point show deterioration trends)
- CAPA execution status and effectiveness assessment
- Sensor calibration result summary (whether any sensors show drift beyond acceptable ranges)
- HVAC system maintenance records and equipment performance trends
- Temperature mapping re-verification results (comparison with previous mapping results to assess whether temperature distribution characteristics have changed)
- Regulatory update and new requirement impact assessment
The annual review report should be prepared under QA department leadership and reviewed by management to serve as the basis for the following year's temperature management improvement plan.
Conclusion
Pharmaceutical warehouse temperature distribution verification is one of the most technically demanding components of the GDP compliance system. From understanding and translating regulatory requirements, scientifically designing mapping protocols, engineering-based sensor placement strategies, MKT and statistical analysis data science methods, to 21 CFR Part 11 compliant monitoring system design and deviation management quality management systems -- every step requires deep integration of multi-domain knowledge spanning refrigeration and air conditioning engineering, metrology calibration, data analysis, and pharmaceutical quality management.
As the market for biologics and cell therapies -- high-value, temperature-sensitive pharmaceuticals -- continues to grow, and global pharmaceutical regulatory authorities continue to raise data integrity requirements, the technical threshold and compliance standards for temperature distribution verification will only increase. Investing in building a temperature management system with rigorous methodology, comprehensive data analysis, reliable monitoring systems, and effective deviation management is not only a basic requirement for passing GDP inspections but also a professional commitment to safeguarding pharmaceutical quality and patient safety. Only through systematic engineering thinking and rigorous quality management can a truly trustworthy pharmaceutical temperature management system be built.